THE POLLEN COUNTS ARE REPORTED AS PARTICLES OF POLLEN PER CUBIC METER OF AIR SEEN IN THE PRIOR 24 HOURS. THE COUNTING METHOD IS BY MY MANUAL IDENTIFICATION OF POLLENS STAINED ON A MICROSOPE SLIDE DAILY COLLECTED IN A BURKARD AIR SAMPLER AS WE HAVE BEEN DOING FOR DECADES.
Thursday October 22nd, 2026, Grass pollen was ABSENT, Tree pollen was ABSENT and Weed pollen was ABSENT
The most recent day from our sampler showed an absence of identifiable pollen. Throughout the weekend there was little to no pollen activity of any kind. Only a few Pine pollen were noted earlier in the week. Not unexpected with the decreases in temperature this past week. As we are in this lower pollination season, we will continue to be checking our sampler on a weekly or twice weekly counting schedule.
Kraig W. Jacobson, MD
Brennon T. Birch RN
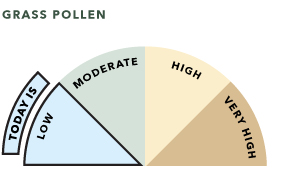
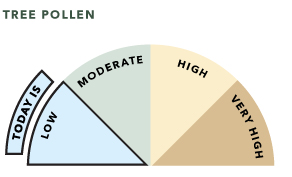
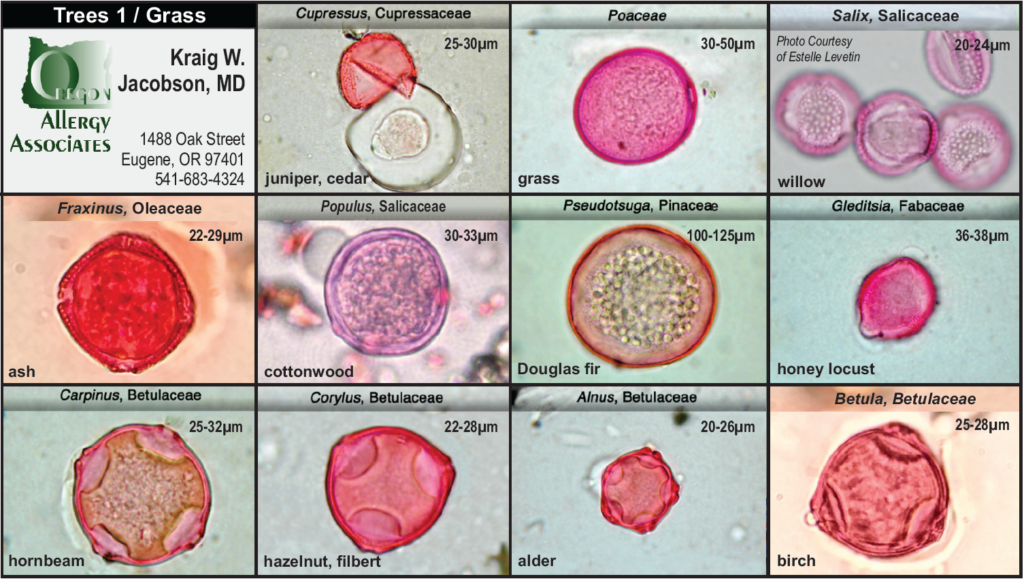
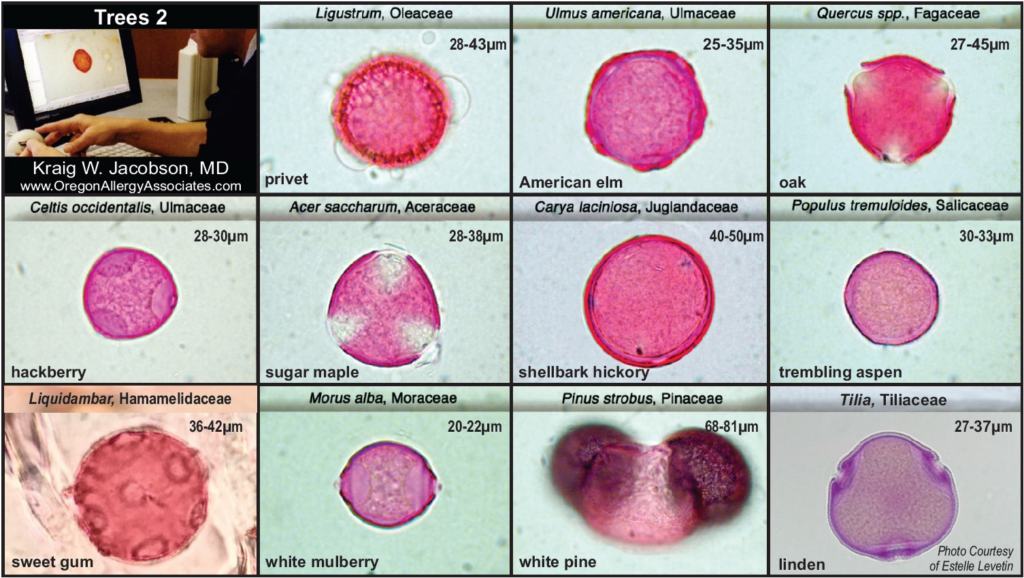
Here are some images of the pollens that we are looking for in the air!
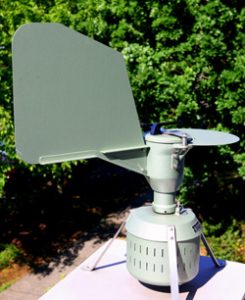 Oregon Allergy Associates is one of about 50 stations nationally that collects and provides pollen counts to a scientific database for the National Allergy Bureau. Neither the NAB or our office can provide historical pollen data to the public. Our physicians provide the counts as a public service to our community. The pollen is collected using a Burkard air sampler, located on the second story of our office at 15th and Oak Street in downtown Eugene, Oregon.
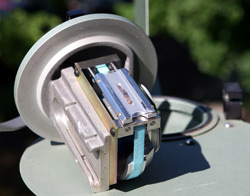
A vacuum pump pulls air through a small port that is directed into the wind. The air impacts onto a greased microscope slide inside the Burkard cylinder. The slide moves down a track in front of the airflow at 2 millimeters per hour. We usually load a slide on Monday morning and change it every weekday. Each count reflects the previous 24 hours of air sampling.
An alternative, more complex adapter with sticky tape on a wheel allows up to seven days of unattended sampling, and is used to obtain weekend samples when daily data is desired, usually during the height of the pollen season.
 After a slide has been exposed, a stain that is used to visualize the pollen is applied for microscopic identification. Each pollen grain seen on one full traverse of the slide is identified and counted at a magnification of 400 times greater than what a normal eye can see. A mathematical equation calculates the number of pollen grains per cubic meter of air sampled.
Windborne pollinating plants and trees are the most commonly allergenic, as opposed to the heavy, sticky pollen in flowers that rely on insects for pollination. Pollen counts are usually higher on warm, windy days. Windborne pollen can travel several miles, although greater concentrations of pollens are seen from trees and vegetation located in close proximity to the sampler.
Oregon Allergy Associates must attend periodic training and certification testing. Additionally, our Allergy and Asthma Research Group is able to provide pollen data in conjunction with studies of investigational treatments for allergies. In addition to offering it as a community service, our physicians enjoy having a scientific correlation with patient symptoms and the air samples.
Your individual daily exposure includes variables that should be considered, such as the amount of time spent outdoors and whether you are walking, biking, running or driving in a car with the windows open. We encourage you to view the pollen counts as a general trend and caution over-interpretation of the data, as no machinery is as reliable as someone with an “allergic nose.”
Oregon Allergy Associates is a part of the Pacific Northwest’s Leading Independent Healthcare Network, Praxis Health. If you are looking for a primary care provider, visit one of our sister clinics below.





 (541) 344-6176